Some debriefing on continuous fiscal deficits and debt issuance
(https://billmitchell.org/blog/?p=61971)
August 29, 2024
A government cannot run continuous fiscal deficits! Yes it can. How? You need to understand what a deficit is and how it arises to answer that. But isn’t a fiscal surplus the norm that governments should aspire to? Why frame the question that way? Why not inquire into and understand that it is all about context? What do you mean, context? The situation is obvious, if it runs deficits it has to fund itself with debt, and that becomes dangerous, doesn’t it? It doesn’t ‘fund’ itself with debt and to think that means you don’t understand elemental characteristics of the currency that the governments issues as a monopoly. These claims about continuous deficits and debt financing are made regularly at various levels in society – at the family dinner table, during elections, in the media, and almost everywhere else where we discuss governments. Perhaps they are not articulated with finesse but they are constantly being rehearsed and the responses I provided above to them are mostly not understood and that means policy choices are distorted and often the worst policy decisions are taken. So, while I have written extensively about these matters in the past, I think it is time for a refresh – and the motivation was a conversation I had yesterday about another conversation that I don’t care to disclose. But it told me that there is still a lot of work to be done to even get MMT onto the starting line.
Consider the US federal government, for example.
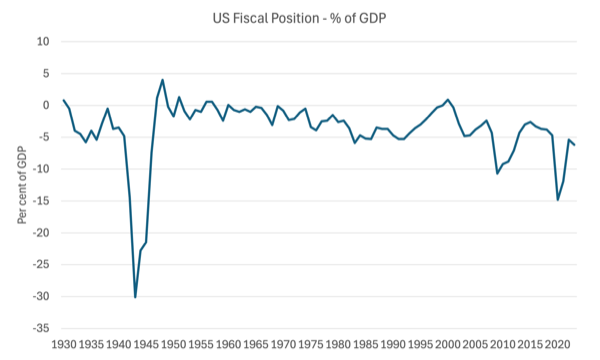
The following graph shows the fiscal position for the US government from 1930 to 2023 as a per cent of GDP.
What do you observe?
The – historical data – shows that between 1930 and 2023, the US government ran deficits in 81 of those 95 years – or 85.2 per cent of the time.
And the other fact is that each time, the fiscal balance went into or close to surplus, an economic contraction followed soon after.
That data is indisputable.
Have a look at the Australian federal data (available HERE).
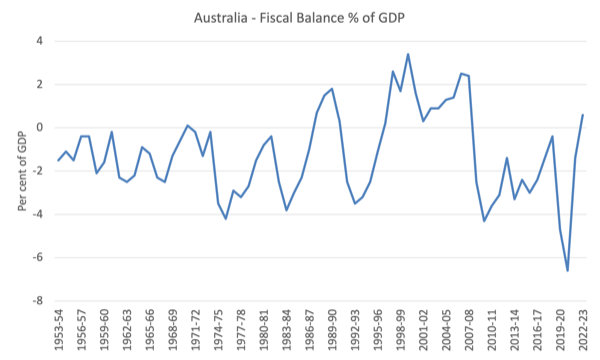
The following graph shows the fiscal position for the US government from 1953-54 to 2022-2023 as a per cent of GDP.
The data currently provided by the government goes back to 1970-71, but the RBA also provides some historical data that allows us to go back to 1953-54.
What you see is mostly deficits.
In the late 1980s, when the then Labor government became obsessed with neoliberalism and the sanctity of surpluses, they recorded four years of surpluses which ended in the worst recession since the Great Depression of the 1930s.
From 1996, the Conservative government, similarly obsessed, recorded consecutive surpluses until they were thrown out of office in 2007.
That brief period in our history has been held out by commentators as the ‘norm’.
But as the graph shows, it was an exceptional period in Australian government financial history.
And moreover, it coincided with the massive build up in household debt – from 51.4 per cent of disposable income in 1996 to 163.5 per cent by the time they left office in 2007.
That ratio is now around 186 per cent as governments continue to pursue austerity.
And we should understand that the two happenings – the fiscal surpluses and the rise in household debt – are intrinsically related.
The pursuit of fiscal surpluses from 1996 coincided with extensive financial market deregulation which saw an explosion of bank credit being absorbed by the household sector.
This was also a time that real wages growth was being suppressed through harsh industrial relations legislation designed to kill off trade unions and shift the balance of power firmly in favour of the employers.
The point is that the only way those fiscal surpluses were able to be recorded over the lengthy period (slightly over a decade) was because economic growth (and the resulting tax revenue growth) was maintained by the increase in household sector indebtedness, which allowed households who were being squeezed by the fiscal austerity and the real wages suppression to maintain growth in household consumption expenditure.
Had the households not built up that debt and used credit to maintain their expenditure growth, the economy would have tanked badly a year or so after the first surplus was recorded in 1996-97 and the fiscal position would have shifted back into deficit quick smart.
The other point to appreciate is that basing a growth strategy on fiscal surpluses and ever increasing indebtedness of the non-government sector is unsustainable as we saw when the GFC hit.
Households, in particular, cannot continue indefinitely to accumulate ever increasing levels of indebtedness.
Eventually, the balance sheet positions become so precarious that minor shifts in economic fortune – such as a rise in unemployment, a loss of casual working hours, or an increase in interest rates – sends the sector into crisis and cut backs in expenditure growth follow soon after.
Those cutbacks plunge the economy into recession, which is accentuated by the build up of fiscal drag resulting from the surpluses.
Those who try to characterise that period of Australian history as the ‘norm’ which all other outcomes should be judged against completely misunderstand these relationships and dynamics.
The ‘norm’ for Australia is characterised by fiscal deficits.
The data shows that between 1953-54 to 2022-2023, the Australian ran deficits for 52 of the 74 years or 74 per cent of the time.
If we excluded the ‘abnormal’ years when household debt was rising dramatically and the household saving ratio plunged below zero, then that proportion rises to 90 per cent of the ‘normal’ time since 1953-54.
So what about context
The macroeconomic sectors are interlinked – government, external and private domestic.
The net spending decisions and outcomes of each reverberate on the others.
This allows us to understand the context in which fiscal policy must be framed.
For example, in Australia’s case, as a capital importing nation, our external balance is typically in deficit – which means there is a net spending drain from the local economy to the rest of the world.
That means that some of the income that the economy produces each period is lost to the domestic spending stream – it leaks out to the rest of the world.
That leakage has been, on average around 3 to 3.5 per cent of GDP since the 1970s.
What are the implications of that?
First, if the private domestic sector (households and firms) desire to save overall, then the government sector must target fiscal deficits or else a recession would follow and the fiscal position will be forced into deficit.
Example:
1. External leakage 3.5 per cent of GDP.
2. Private domestic leakage (from overall saving) 2 per cent of GDP.
3. For national income to remain unchanged, the fiscal position must at least offset those leakages with a commensurate injection of net spending – that is a deficit.
Whenever there is an external deficit, the fiscal position must at least equal that deficit or else the private domestic sector will be forced into deficit and increasing indebtedness.
That should help you understand what represents the ‘norm’ for a nation.
In the case of Norway, for example, which currently has external surpluses via its oil and gas reserves, then it can still experience overall private domestic saving with a fiscal surplus, without compromising economic activity and the provision of first-class public infrastructure and services.
Their context is different because the external sector provides a net spending injection as opposed to nations running external deficits which must offset the spending drain with domestic spending injections.
Funding by debt?
Imagine a new country emerges and the government announces it will use a new currency and that all citizens must now relinquish their tax liabilities using that currency.
(Kasurako, Euskal Herri INDEPENDENTEA, bere moneta propioarekin, edozein delarik haren izena.)
What becomes the problem?
Simply that the non-government sector, which uses the government’s currency, does not have any of the new currency and will thus be unable to pay their tax liabilities, among other things.
Solution?
The government spends the new currency into existence.
How?
Through procurement processes, pension payments etc.
The non-government sector immediately has an incentive to supply its productive resources to the government in order to earn the new currency.
The sequence is obvious – new currency –> tax liability 1–> public spending –> tax payments.
Should the public spending exceed tax payments then we record a fiscal deficit and the non-government sector has a flow of saving (in the new currency) which accumulates as a stock of wealth.
That wealth was only possible because the fiscal deficit occurred – that is, the government didn’t tax away all its spending injection.
Now imagine that the government announces a portfolio choice for the non-government sector: an interest-bearing bond (debt instrument) to replace the currency denominated wealth (from the prior saving).
The non-government sector now might convert some of their currency wealth into interest-bearing bonds and the statistician would record an increase in national debt.
But that would just reflect the portfolio mix in the non-government sector between in this simple case currency holdings and interest-rate bond holdings.
Where did the funds come from that allowed the non-government sector to purchase the government debt?
Answer: Prior savings accumulated as currency wealth.
Where did that wealth come from?
Answer: Prior fiscal deficits – government spending not fully taxed away.
In other words, it was the fiscal deficits that provided the funds for the non-government sector to purchase the government debt.
On what planet would we construct those dynamics and causalities as the ‘debt funding the deficits’?
The logic doesn’t change when we complicate the story with real world institutions and behaviours.
Governments do not need to issue debt in order to run fiscal deficits.
The debt issuance does not fund the government deficits.
Mainstream economists say that if the debt is not issued there would be accelerating inflation – their so-called ‘money printing’ case which they eschew.
But that is also nonsensical as a rule.
Given we understand the decision to purchase the government debt is a portfolio choice on desired mix of different components of the wealth holdings in the non-government sector, it should be clear that the ‘funds’ were not going to be spent into the economy anyway.
And if the fiscal deficit injection pushed total expenditure beyond the capacity of the economy to respond (from the supply-side) by increasing production, then we would consider that an imprudent policy position, but, equally, one that is easy to change – cut the expansion.
Ondorioak
The principles are clear:
1. Governments can run continuous fiscal deficits forever and the desired magnitude will depend on the context.
2. Governments which issue their own currency do not fund their deficits with debt issuance. The deficits, rather, fund the capacity of the non-government sector to net save, which then allows for wealth portfolio choices, that might include the purchase of government debt.
1 Ikus hauxe ere: Collected Works of Warren Mosler (Tax Liabilities). Ikus, halaber, Moneta-Teoria Modernoa (MTM): Bill eta Warren-en abentura bikaina

